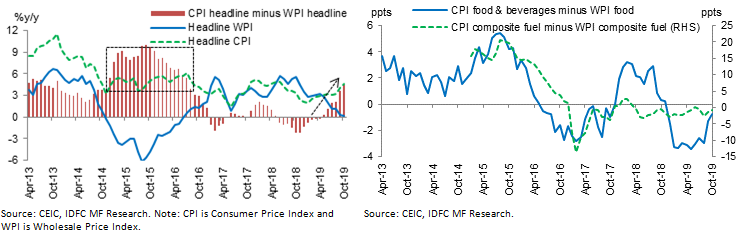
The rising divergence between CPI and WPI has again raised eyebrows, with typical explanations like difference in the index components, weights, CPI retail margins, the lead WPI has over CPI, etc. being highlighted. In October, the headline divergence (CPI minus WPI) was 4.5ppts (percentage points), a steady rise from -0.8ppt in January. Is this the beginning of another 2015-16 period, when the divergence had stayed elevated and peaked at 10ppts in September 2015? We examine this through four key questions.
1) What is driving the divergence now vs. 2015-16 – extreme readings, component weights or both?
We compared the average year-on-year (y/y) readings and weighted y/y contributions of the index components during the current phase (Jan-Oct 2019) with the previous high-divergence core period (Oct14-Sep16). We also looked at their inherent volatility (standard deviation) and the difference in their CPI and WPI weights. We separated our analysis into common and exclusive components, given the difference in CPI and WPI index composition.
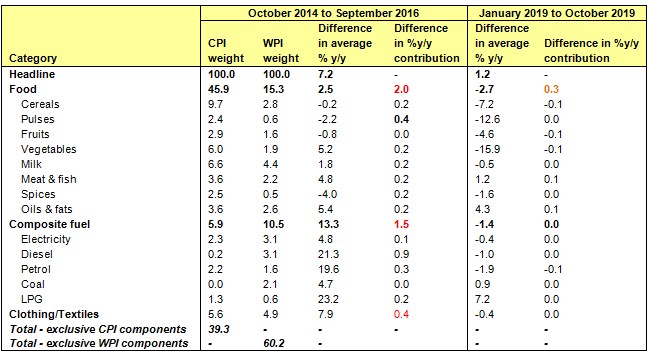
Note: The y/y CPI contribution was 1.9% in Oct14-Sep16 vs. 2% in Jan-Oct19. The y/y WPI contribution was -1.5% in Oct14-Sep16 vs. 0.6% in Jan-Oct19.
Source: CEIC, IDFC MF Research. Note: 1) y/y contribution is calculated as the product of y/y and weight, 2) ‘Difference’ above is for CPI minus WPI, 3) Exclusive CPI components include a) CPI miscellaneous ex-petrol, diesel, b) CPI housing and c) CPI fuel & light ex-electricity, coal & LPG. 4) Exclusive WPI components include a) WPI manufactured products ex-food and textiles, b) WPI primary articles ex-food and c) WPI fuel & power ex-coal, LPG, petrol, diesel and electricity.
Observations:
- During Oct14-Sep16, the divergence was broad based with food being one of the major drivers. The difference in the average contribution of food to headline growth (CPI minus WPI) was 2%, which compares with 0.3% now. Within food, the difference in contribution then was maximum for pulses (0.4%). This was the period of high pulses inflation, followed by a sharp rise in Minimum Support Prices (MSP). The other major food-drivers were vegetables, milk, meat, etc.
- Given fuel index compositions are different, we created our own ‘composite fuel’ CPI and WPI indices comprising only the common components namely petrol, diesel, LPG (Liquefied Petroleum Gas), coal and electricity. The divergence in contribution was high at 1.5% then vs. 0% now, the main driver being diesel.
- Most of the exclusive core components also showed divergence then, with very low y/y WPI readings.
- In the current phase, the divergence is driven more by core components, slightly by food and hardly by fuel.
- Across periods, the inherent volatility of components is expectedly found to be highest for vegetables, pulses, diesel, petrol and LPG.
Inferences:
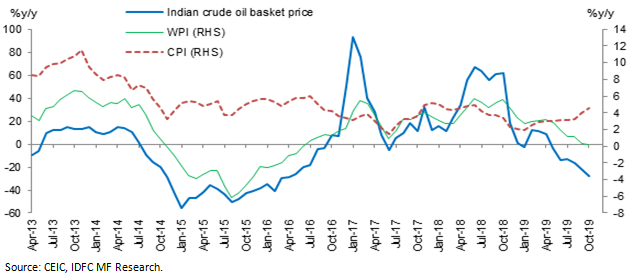
- Oct14-Sep16 was the period when crude oil prices crashed. However, the drop in CPI readings for petrol and diesel were much lower than that in WPI. This was owing to the hike in excise duty (included in the CPI but not in WPI) during the period, by a total of Rs. 13.5 per litre, in nine instalments.
- We looked at the difference in y/y contributions of CPI and WPI components to headline growth, to understand the impact of difference in both readings and weights. This suggested the difference in weights acts as an amplifier of diverging y/y readings. For e.g., diesel and petrol witnessed a similar sharp divergence between CPI and WPI readings during the period, but the difference in their weights is 3% and 0.6% respectively. This caused the difference in headline-growth-contribution to be 0.9% for diesel and only 0.3% for petrol. Pulses stood out, despite similar y/y readings, due to the same reason.
- Expectedly, the WPI has historically moved in line with change in crude oil prices unlike CPI. Thus any sharp change in oil prices impacts most WPI components, in addition to the direct impact on fuel products.
- Thus, apart from the divergence in food, the Oct14-Sep16 episode was almost entirely defined by the crash in crude oil prices and the excise duty hikes on diesel and petrol, the impact of which was amplified through the components with large difference between their weights in CPI and WPI (diesel).
2) Does the WPI lead CPI, has this changed over time and does this impact the divergence?
We looked at the correlation of WPI and CPI for the headline index and common components – food, ‘composite fuel’ and textiles – to check a) whether WPI leads CPI in the 0-12 months range and b) how this has been changing over time. For the latter, we used rolling correlations changing the start date but keeping the end date constant at October 2019. The intent of the exercise was to check if component-divergences were any lower, adjusting for WPI-leads.
Inferences:
- Only food and, particularly, our in-house composite fuel index exhibited strong correlations (readings above 0.7) at 0-1 months range. The correlation at the headline level was weak, and in fact negative, in many instances.
- The correlation for food has not been consistent, weakening over time at the 0-1 month range, but getting stronger at the 3-4 months range of late.
- The correlation for common fuel components has been strong on a real-time basis, and this has been even stronger post the shift to daily fixing of petroleum product prices from June 2017.
- Thus, the CPI-WPI divergence at the headline level was the same, even after adjusting for any WPI-headline lead over CPI. Interestingly, the divergence is not any different for the components with higher correlations (food, fuel) as the wedge in the magnitude of readings continues to define the divergence, notwithstanding movement in the same direction implied by stronger correlations.
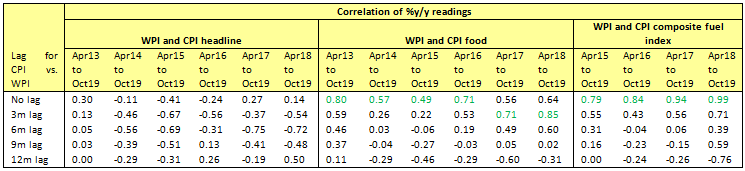
Source: CEIC, IDFC MF Research. Note: The composite fuel CPI and WPI indices are our in-house indices constructed using only the common fuel components namely petrol, diesel, LPG (Liquefied Petroleum Gas), coal and electricity.
3) What does the study indicate about the state of the economy and how could the divergence play out this time?
- The fact the current phase of divergence is driven more by the exclusive core components in WPI and CPI, and to a lesser extent by food and fuel, is a manifestation of the lack of pricing power with the manufacturers. This is unlike the 2015-16 phase when supply-side factors (crude oil and food prices) almost entirely defined the divergence. Alongside the recent weak core CPI readings, this points to the lack of consumer-demand and, thus, the degree of slowdown in the economy today.
- Incrementally, the path of future CPI-WPI divergence could be driven more by crude oil price movements because core CPI has anyways been weakening quite fast, reducing the gap with lower WPI core readings. If oil prices remain broadly flat, the core-gap should narrow further. If it crashes, it could make WPI components drop much more and widen the gap with CPI. If it rises sharply, it could first narrow the gap and then cause WPI to rise above CPI, widening the gap in the opposite direction.
- Of course any government measures, such as excise duty hikes, would impact the divergence. However, given the government increased it considerably in 2015-16 and already announced a Rs. 2 per litre hike this July, further strong hikes look unlikely, particularly in the context of an already-weak consumer demand. That said, any cuts if crude oil prices fall are unlikely too as fiscal space remains very tight.
- Any supply side measures by the government to ease food prices if (say) the current spike continues could also have an impact on the divergence, again amplified by the difference in weights.
4) Are we being overly concerned about divergence and missing the woods for the trees?
The difference in amplitude and volatility of WPI readings vs. CPI is well understood. CPI reaction to input price movements is slower and more measured compared to WPI, owing to company price-setting behaviour and market share dynamics. However, any divergence beyond the usual trend over a period of time could be a red flag but interpreting this at the headline level could be misleading. Only a careful study of the components, its weights, the domestic & global economic contexts reveals the true drivers and enables us understand how another episode of divergence could play out. Further, there are other critical aspects too one should focus on.
- Apart from divergence, the key trigger for a detailed study could actually be the consistent movement of a WPI and CPI common-component in the opposite direction. For e.g., within food, pulses, fruits & vegetables have always broadly moved in the same direction. However, this is not true for cereals. This could be most likely due to high government stocks and supply-side management measures for rice and wheat. Similarly, WPI-textiles and CPI-clothing have not always moved in the same direction over a period of time. While the sub-components are admittedly not exactly the same, this could also be a reflection of global cotton prices ruling below domestic prices for some time now (also reflected in the 45% y/y surge in textile imports during Apr-Oct 2019).
- A more higher level issue is the fact that our WPI captures prices of a very different basket of goods vs. CPI and does not include services at all. Thus, when we update the basket of goods and its weights, we should also include prices of services or publish a separate services-price-index at both the wholesale and consumer levels.
- An even more pertinent argument would be for a shift to PPI (Producer Price Index) from WPI. PPI measures the change in revenue received by domestic producers of goods and services in the economy. This excludes mark-ups and taxes, unlike WPI, giving a more accurate measure of underlying demand and growth. For e.g., the U.S. PPI by definition includes services, although the coverage is slightly lower vs. CPI. It has exclusions such as ‘owners’ equivalent rent’ which is the implicit rent owner-occupants would have to pay if they were renting their homes. Further, it includes exports but excludes imports (unlike CPI) as the latter is not produced domestically. There are technical differences too, such as the frequency of updation of weights, usage of geometric mean for CPI (which leads to lower measures of inflation in periods of price increases) unlike PPI, etc. Despite this, it is no wonder most of the advanced economies shifted to PPI long ago, as its economic utility far outweighs that of the WPI!
Thus, the CPI-WPI divergence could be driven by very different y/y readings or weights (e.g. diesel with excise duty impact and large difference in weights), and is not very different even after adjusting for any lead WPI components could have over CPI. The current divergence is driven more by exclusive core components, reflective of the current slowdown, unlike last time when it was driven by supply side factors (oil, food) which could still impact the divergence from here on. A study of contradicting trends in CPI-WPI common-components, capture of services prices and a shift to PPI from WPI are more critical aspects to focus on.
Disclaimer:
MUTUAL FUND INVESTMENTS ARE SUBJECT TO MARKET RISKS, READ ALL SCHEME RELATED DOCUMENTS CAREFULLY.
The Disclosures of opinions/in house views/strategy incorporated herein is provided solely to enhance the transparency about the investment strategy / theme of the Scheme and should not be treated as endorsement of the views / opinions or as an investment advice. This document should not be construed as a research report or a recommendation to buy or sell any security. This document has been prepared on the basis of information, which is already available in publicly accessible media or developed through analysis of IDFC Mutual Fund. The information/ views / opinions provided is for informative purpose only and may have ceased to be current by the time it may reach the recipient, which should be taken into account before interpreting this document. The recipient should note and understand that the information provided above may not contain all the material aspects relevant for making an investment decision and the security may or may not continue to form part of the scheme’s portfolio in future. Investors are advised to consult their own investment advisor before making any investment decision in light of their risk appetite, investment goals and horizon. The decision of the Investment Manager may not always be profitable; as such decisions are based on the prevailing market conditions and the understanding of the Investment Manager. Actual market movements may vary from the anticipated trends. This information is subject to change without any prior notice. The Company reserves the right to make modifications and alterations to this statement as may be required from time to time. Neither IDFC Mutual Fund / IDFC AMC Trustee Co. Ltd./ IDFC Asset Management Co. Ltd nor IDFC, its Directors or representatives shall be liable for any damages whether direct or indirect, incidental, punitive special or consequential including lost revenue or lost profits that may arise from or in connection with the use of the information.